Every performance marketer who’s ever considered a billboard has asked the same question, and it isn’t “does OOH work?” It’s: how do I prove it worked?
Fair question. If you’ve spent your career in a world of click IDs, pixels and last-touch models, “put a poster on a wall and trust the process” sounds like a step backwards. It isn’t but only if you set the campaign up properly before it goes live, not after.
This isn’t another “billboards still work” piece. It’s the attribution stack: the specific mechanisms you can put in place to measure a billboard campaign with the same rigour you’d apply to a paid social budget. Some of it gives you clean, direct numbers. Some of it gives you directional evidence. Used together, you get a picture that’s honest about what OOH actually delivers — awareness and demand generation measured in commercial terms, not vibes.
Why last-click thinking breaks on OOH (and why that’s not a dealbreaker)
A billboard doesn’t have a click ID. It can’t be attributed the way a paid search ad can. If you go looking for a direct last-touch conversion path, you won’t find one, and you’ll conclude the channel is unmeasurable.
That’s the wrong test. Billboards sit at the top and middle of the funnel, they build recognition and trigger a search, a visit, or a call days or weeks later. The right question isn’t “which billboard caused which sale?” It’s “did the presence of this billboard change our numbers, in this area, versus what we’d expect without it?” That’s a solvable problem, and it’s the same logic performance marketers already use for brand campaigns, TV, and podcast advertising. You’re just applying it to a physical medium.
Here’s what that stack actually looks like, roughly in order of how much rigour and budget each layer takes.
Don’t skip the free method: just ask
Before any of the tracked links, codes or platforms, there’s a method that costs nothing, needs no setup, and most businesses still don’t do it properly: asking. “How did you hear about us?” As a standing question on every enquiry form, every booking confirmation, every sales call and every till transaction where it’s practical to ask, is one of the most underused attribution tools in local and service marketing, largely because it’s not glamorous enough to feel like “real” data.
It should be treated as exactly that. If you’re running a billboard on the A24, add “billboard on the A24” as a specific answer option rather than lumping it into a generic “outdoor advertising” or “other” bucket;vague categories produce vague, unusable data. Train your sales team or front-of-house staff to ask it consistently rather than only when they remember, because inconsistent capture makes the resulting numbers unreliable for comparison over time. And treat the answers as a genuine input to your reporting, not an anecdote. If fifteen new enquiries in a month all cite the same board, that’s a real, if unscientific, data point sitting alongside your search-lift and QR numbers, not a nice-to-have quote for a case study.
The obvious limitation is self-report bias: people misremember, conflate channels, or credit the thing they saw most recently rather than the thing that actually moved them. That’s precisely why this method works best as a corroborating layer rather than your only measurement, it’s the human cross-check that either backs up what your QR codes and search-lift data are already telling you, or flags a discrepancy worth investigating (a spike in “found you through a billboard” answers with no matching search-lift movement, for instance, might mean people are misattributing a different channel, or that your search-lift baseline needs revisiting). Cheap, unglamorous, and worth doing properly.
Start with the easiest win: unique landing pages and UTMs
The simplest fix is also the one most campaigns skip. If your billboard and your homepage both point to “oursite.com,” you’ve thrown away the easiest attribution win available before the campaign has even launched. Give every site its own landing page or, at minimum, a UTM-tagged URL, and where budget allows, build a genuinely separate page per location rather than just a tagged link it lets you tailor the message to the local audience and gives you a clean, isolated conversion number with no shared traffic to untangle. It’s also worth remembering that a meaningful share of people who see a billboard won’t click or scan anything at all; they’ll simply type your brand name into Google later that day. That’s not a failure of attribution, it’s a different measurement problem, and it’s the one brand search lift is built to solve, which we’ll come to shortly. None of this costs more than ten minutes of setup, which is precisely why there’s no excuse for a campaign running without it.
Make QR codes location-specific, not campaign-wide
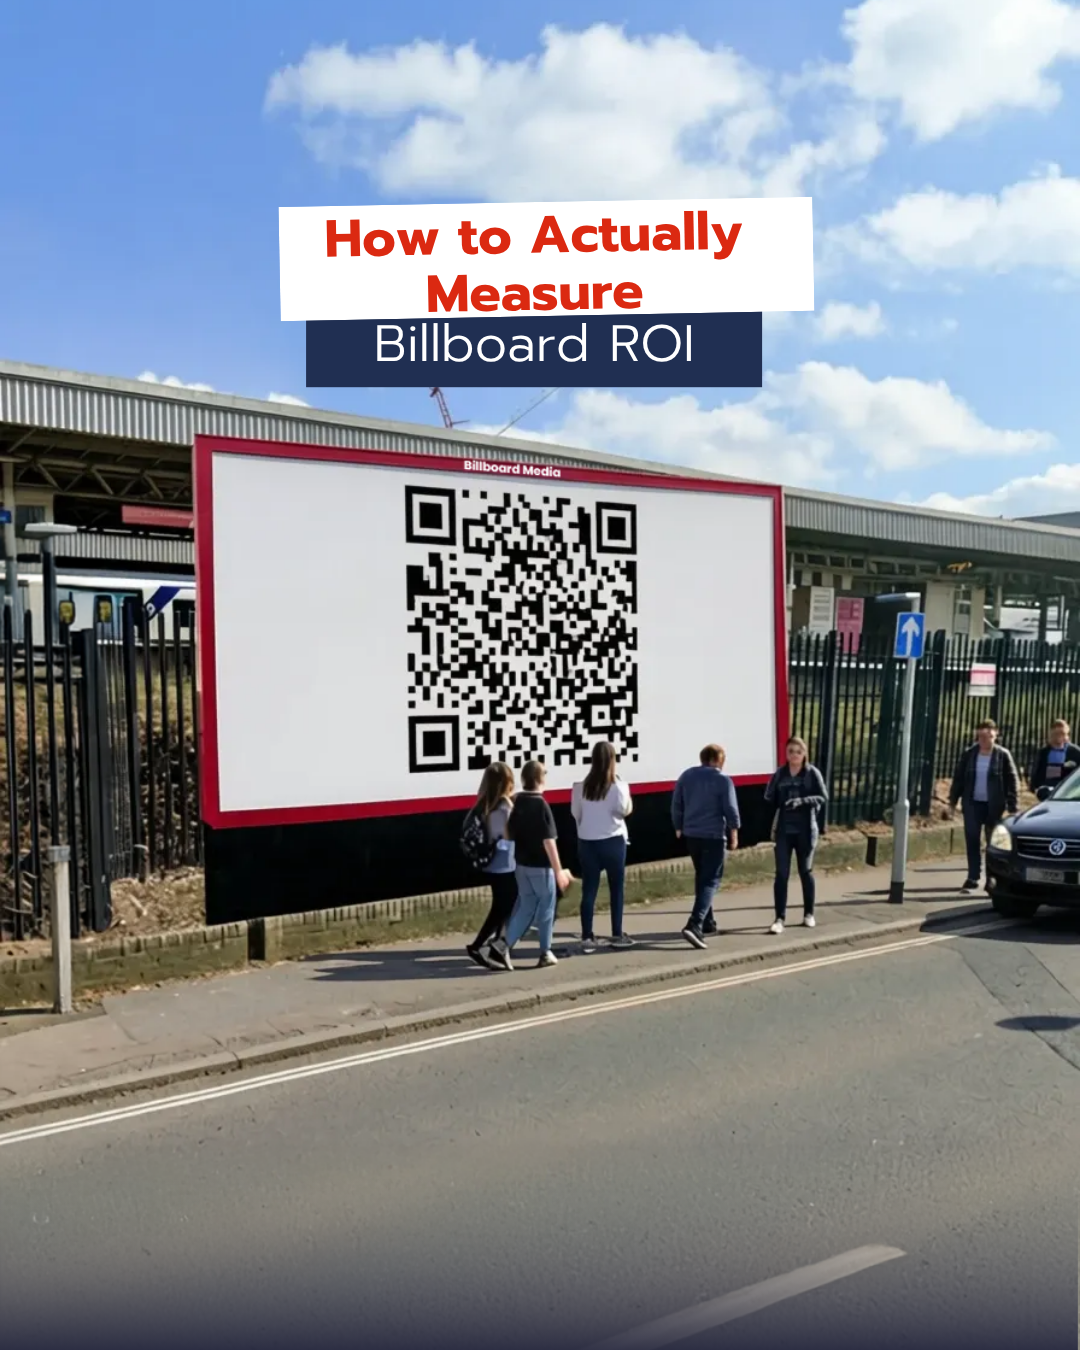
QR codes on OOH stopped being naff around 2020 and are now standard practice, but most brands still generate a single generic code for the whole campaign, which throws away the one thing that makes QR data useful: knowing which site drove which scan. Generate a separate code per location, each pointing to its own tracked URL, and use a platform that logs scan time, location and device rather than just a running total.
It’s also worth pairing the code with a genuine incentive: a discount, a free consultation, entry to something rather than a bare “learn more,” because incentivised scans convert at meaningfully higher rates and give you a cleaner signal that the traffic is commercially real rather than idle curiosity. Done properly, this gives you direct, countable engagement broken down by exact site, which is what lets you compare performance across locations and shift budget toward the ones actually earning their keep.
Use promo codes to tie the board directly to revenue
If your business runs a sales team, a booking form or an e-commerce checkout, a unique promo code per site is one of the cleanest attribution tools available for OOH, and it’s almost never set up properly. Assign a distinct code to each location something as simple as BOARD-KINGSTON10 and route it through your CRM or checkout so redemptions tag automatically to that site.
If you’re running several boards at once, staggering when each one goes live makes the data considerably more useful, because it isolates which specific site is driving the uplift rather than crediting the whole campaign equally. Every redemption becomes a directly attributable, revenue-linked data point, which makes this the single best mechanism for proving hard ROI to a finance stakeholder who has no interest in impressions.
Track brand search lift the way you’d track any brand campaign
This is the method that tends to convince sceptical performance marketers, largely because it’s the same logic they already trust from brand-lift studies on other channels. Pull your branded search volume, Google Trends at a minimum, or Search Console and GA4 data if you have the traffic to support it for a clean baseline period of four to six weeks before the billboard goes live. Keep tracking it through the campaign and for a few weeks after it comes down, and compare the trend against both your baseline and the seasonal pattern you’d normally expect; there’s no value in launching a test in December and comparing it to a quiet August. Where possible, compare the area local to the billboard against a similar area with no exposure, using regional search data or enquiry volume as a rough control.
A billboard that’s genuinely working produces a visible step-change in branded search that tracks with the flight dates and doesn’t fully decay back to baseline once it’s run long enough — that persistence is the recognition effect compounding, and it’s also the reason a twelve-month flight consistently outperforms a one-month one. What this tells you, ultimately, is whether the board is doing the job OOH is actually best at: building enough recognition that people go looking for you off the back of it.
Set up call tracking if your business runs on inbound calls
For trades, estate agents, healthcare and local services, this is arguably the highest-signal, lowest-effort method on the list, and the one that should be treated as non-negotiable rather than optional. Assign a unique tracked number to each site, forwarding to your normal line, and use a platform that logs call volume, time of day and, where legally permitted, records calls for quality review. Cross-reference any spikes against your flight dates and, where you’re running multiple sites, against which specific board was live at the time. For service businesses this often ends up being the single most convincing number in the whole report a direct, dated, location-tagged line between the board going up and the phone starting to ring.
Reach for footfall and geo-lift testing once you’re running at scale
This is the gold-standard method used by larger advertisers running OOH across multiple markets, and it’s increasingly accessible to SMEs through mobile location data providers and retail footfall tools. The structure is a classic test-versus-control design: choose a test area where your billboard is live and a comparable control area with similar demographics and footfall patterns but no billboard, then measure footfall or store visits in both across the same period.
What matters is the difference in uplift between test and control, not the raw footfall number in the test area alone, because that difference is what controls for the general market movement that would have happened regardless. Run it for four to six weeks either side of the campaign to capture lag effects, since billboard-driven visits rarely happen on day one. It’s a heavier lift, and for smaller campaigns it often needs third-party data tools but it’s the right investment once you’re running across several sites and need to prove incremental value to a CFO rather than a gut feeling.
What this actually means for how you plan a campaign
You don’t need all six of these running simultaneously on a single-site campaign, but “how will we measure this” needs to be answered before launch, not raised as an afterthought three weeks in. For a straightforward single-board SME campaign, a UTM-tagged landing page, a location-specific QR code with a real incentive, and a branded search baseline pulled in advance will get you a defensible picture. For multi-site campaigns, or anything being reported up to a CFO or an agency client, add promo codes tied to your CRM, call tracking per site, and a proper geo-lift test with a defined control area.
The pattern that runs through nearly all of this is timing: baseline data, tracked numbers and control-area selection can’t be retrofitted once a campaign is already live. If you’re planning a billboard flight, the measurement plan belongs in the media plan itself, not in the report you scramble to produce once someone asks how it went.
None of this gives you the single-number, self-reported attribution you get from a Meta Ads Manager dashboard and if a channel promises you that kind of precision on a brand-building medium, be sceptical of the number, not the channel. What this stack gives you instead is a triangulated view: hard conversion numbers from the direct-response mechanisms (QR, promo codes, calls), directional recognition evidence from the brand-level mechanisms (search lift, geo-lift), and a human cross-check from simply asking. None of these three layers is complete on its own, that’s the point of running them together. Together, that’s a materially more rigorous case than “billboards feel like they’re working,” and it’s the case that actually moves a sceptical performance marketer’s budget.
Looking to drive real footfall and local dominance?
Stay up to date with Billboard Media via our social media channels and subscribe to our newsletter if you want to be updated with information about available billboards in your area.
Get on our priority list for a location you’re interested in by sending us a WhatsApp message.